The need for big data analytics is ever-growing as businesses constantly capture, store and process large volumes of data. With large amounts of data being collected from different sources it is important to organize these diverse and complex datasets. Our data analytics software will help in processing these datasets to generate business value from the data collected.
Our data analytics software uses a variety of techniques to process data such as:
Data Mining which processes large datasets to identify trends, patterns and correlations found in the data.
Predictive Analytics which uses machine learning and statistical algorithms based on historical data to predict the likelihood of future outcomes.
Analyzing big data in this way provides you with data-driven insights, helping you make more accurate and informed decisions for better overall business performance.
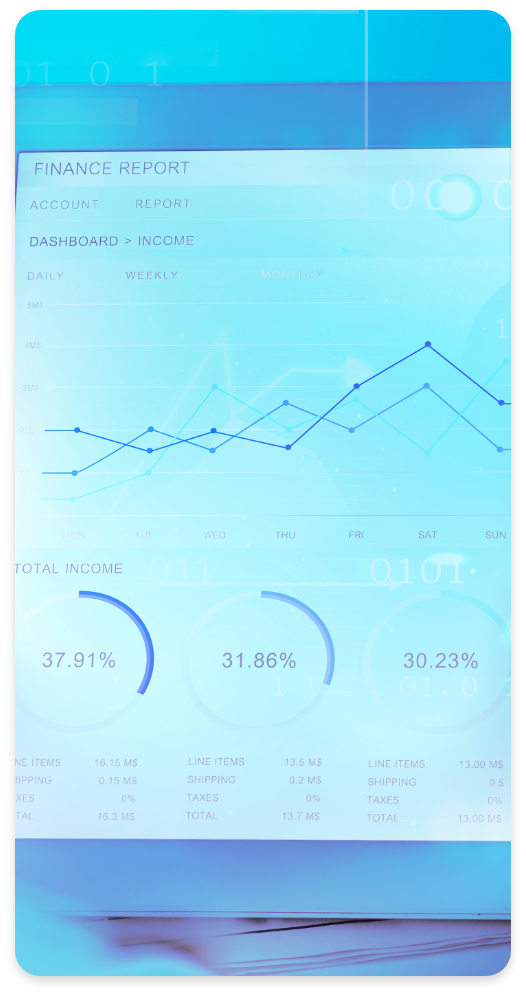
Reports and dashboards give you a graphical representation of the large amounts of data your business collects. It’s generally accepted that data and information is much easier to consume and understand in a visual format. Our data visualization tools will get your data to tell a story by showing trends and correlations between datasets.
Centralized dashboards can be used in your business to create a single source of the truth for all data and information gathered. With customizable reports and dashboards you can analyze different datasets to identify specific trends and patterns. Our data visualization tools provide you with deeper insights, allowing you to make better data-driven decisions.